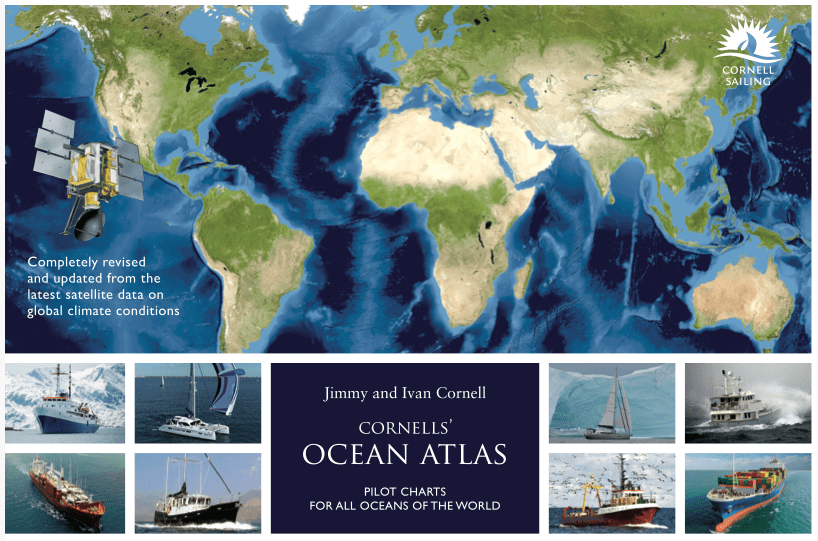


Jimmy Cornell, experienced sailor and bestselling author, has teamed up with his son Ivan to produce a fully updated and revised third edition of Cornells’ Ocean Atlas aimed at navigators planning an offshore voyage.
Pilot charts have been the most important passage planning tools since the middle of the nineteenth century. In spite of all the advances in electronics and aids to navigation, any prudent navigator planning a longer voyage should continue to refer to pilot charts as valuable sources of information on weather conditions, tropical storm seasons and critical areas, as well as prevailing winds and currents.
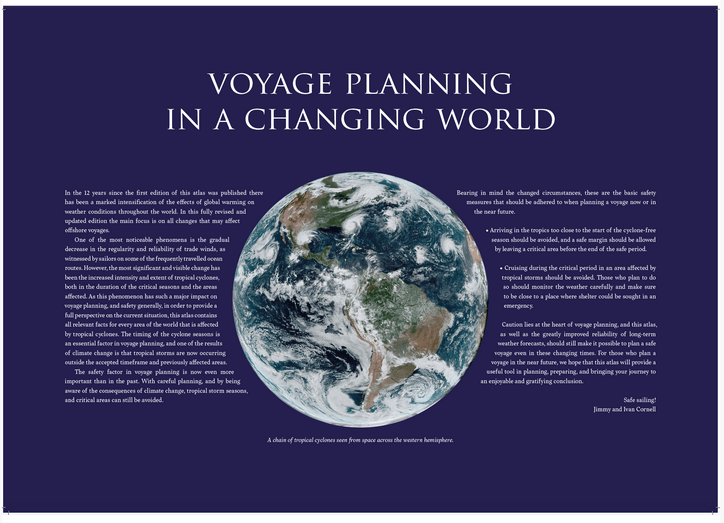
In the 12 years since the first edition of this atlas was published there has been a marked intensification of the effects of global warming on weather conditions throughout the world. In this fully revised and updated edition the main focus is on all changes that may affect offshore voyages.
One of the most noticeable phenomenon is the decrease in the regularity and reliability of trade winds, as witnessed by sailors on some of the frequently travelled ocean routes. However, the most significant and visible change has been the increased intensity and extent of tropical cyclones, both in the duration of the critical seasons and the areas affected. As this phenomenon has such a major impact on voyage planning, and safety generally, in order to provide a full perspective on the current situation, this new edition contains all relevant facts for every area of the world that is affected by tropical cyclones.
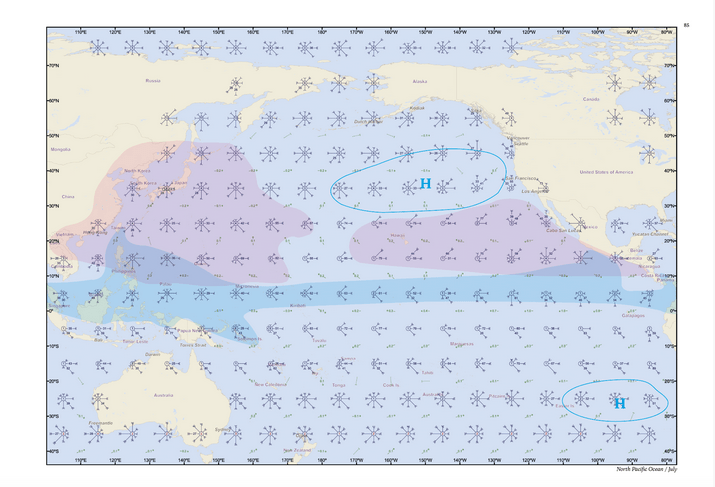
To present an accurate picture of the actual weather conditions that prevail in the world’s oceans, the pilot charts featured in this atlas are based on the data collected by a network of meteorological satellites, augmented by observations obtained from meteorological buoys and other sources, during the last twenty-five years. The most detailed information is displayed in windroses, with every single windrose being based on a total of 218,000 samples of data.

The windrose arrows fly with the wind and the length of each arrow shows the percentage of the total number of observations in which the wind has blown from that cardinal point. The number of feathers shows the force of the wind, which has been recorded most frequently from that sector. The wind force is measured on the Beaufort scale, with each feather being equivalent to one unit of wind force, so that four feathers represent average force 4 winds from that direction for that month. In areas with prevailing winds, the resulting arrow would be too long to be shown in its entirety, in which case for percentages higher than 25, the percentage is shown numerically on the shaft. The figure in the centre of each windrose gives either the percentage of calms in blue (less than force 2), or the percentage of storms in red (more than force 7), whichever is greater.
Ocean currents are shown as green arrows indicating their prevailing direction and rate in knots. Variable currents are shown as a dotted arrow, its direction being determined by the highest percentage of currents recorded to set in that direction.