Collection: CMOR Bathymetric Charts
LESS TIME, LESS FUEL, MORE FUN
The best diving and bottom-fishing spots are the ones that don’t show up on the paper or digital charts and aren’t marked on commercially available fishing maps. Instead, they’re the forgotten wrecks, the isolated reefs, the ledges hidden between the contour lines — places you spend hundreds of hours on the water and burn thousands of dollars in fuel to find.
Now, though, CMOR Mapping’s chartplotter-compatible bathymetry reveals those spots for the first time. With resolution as high as 1 meter (each pixel represents a single square meter of bottom) and coverage of the entire bottom, you see every bump in remarkable detail. Just as importantly, you see the areas of featureless underwater desert, where you don’t need to spend your time looking.
SEAMLESSLY COMPATIBLE
CMOR Mapping imagery is seamlessly compatible with most Simrad, Lowrance, B&G, and Raymarine chartplotters as well as some Furuno NavNet and Mercury VesselView systems. (See our FAQ page for a full list.) Just insert the Micro SD card (SD adapter included) and zoom in on the coverage area to see bathymetry data. Your vessel icon is overlaid on the CMOR data, showing you exactly where you are in relation to bottom features.
All vector data available on your plotter — tides, nav aids, routes, waypoints, etc. — can also be viewed as an overlay ifdesired. In simple terms, a CMOR card essentially adds another layer of extremely valuable data to what you already see on your plotter.
If your chartplotter isn't compatible with CMOR Mapping products, we offer a cost-effective and completely portable solution based around the Simrad GO series touchscreen plotter.
COMPLETE AND DETAILED
Most fishing maps and charts that show depth contour lines interpolate those lines from historical sounding data. In other words, the contours are drawn by looking at the measured depth at a number of points and then making educated guesses about what the bottom looks like between those points. In many cases, the results are fairly accurate. But isolated features — a 5-foot ledge between two soundings a quarter mile apart, for example — are easily missed.
In contrast, CMOR Mapping data is the result of methodical surveys with high-resolution echosounders. There is no interpolation, no guesswork, and no unverified “hotspots” reported by local captains. All you see is a complete, accurate, and highly detailed representation of the bottom, including many features that are not shown on any other chart or fishing map.
A NEW LEVEL OF FOCUS
The value of CMOR Mapping imagery when fishing or diving a new area is obvious — instead of relying on “public numbers” or feeling your way along looking for more productive spots, you’re immediately in the game.
What isn’t so obvious is its value even in your home waters.
Not only will you see features you never knew existed — things you may have run right past a hundred times — but you’ll also see known features in game-changing detail. Large, dispersed artificial reef areas, for example, come into an entirely new level of focus, with each individual piece of structure clearly visible.
-
-
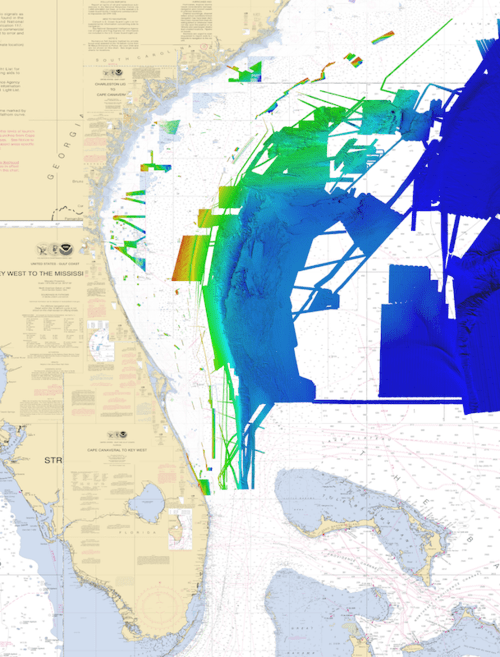
- CMOR Mapping Chart: North Florida, Georgia, & South Carolina Version 2
- Regular price
- $700.00
- Sale price
- $700.00
-
-
-


- Previous page
- Page 2 of 3
- Next page